Table of contents
I’m stunned if you’ve never heard the word “transistor”. I think most people have heard the word. What I find funny is that almost nobody understands in full detail how transistors work.
Through my 30 year venture into the world of electronics I’ve met “analog designers”, or people that should understand exactly how transistors work. I used to hire analog designers, and I’ve interviewed hundred plus “analog designers” in my 8 years as manager and I’ve met hundreds of students of analog design. I would go as far as to say none of them know everything about transistors, including myself.
Most of the people I’ve met have a good brain, so that is not the reason they don’t understand. Transistors are incredibly complicated! I say this, because if at some point in this document, you don’t understand, then don’t worry, you are not alone.
In this document I’m focusing on Metal Oxide Semiconductor Field Effect Transistors (MOSFETs), and ignore all other transistors.
Metal Oxide Semiconductor
The first part of the MOSFET name illustrates the 3 dimensional composition of the transistor. Take a semiconductor (Silicon), grow some oxide (Silicon Oxide, SiO2), and place a metal, or conductive, gate on top of the oxide. With those three components we can build our transistor.
Something like the cartoon below where only the Metal (gate) of the MOS name is shown.
The oxide and the silicon bulk is not visible, but you can imagine them to be underneath the gate, with a thin oxide (a few nano meters thick) and the silicon the transparent part of the picture.
The length (L), and width (W) of the MOS is annotated in blue.
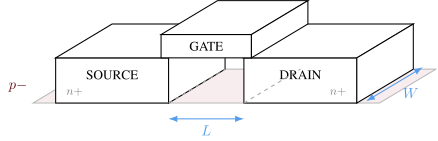
Figure 1: 3D crossection of a transistor
MOSFETs come in two main types. There is NMOS, and PMOS. The symbols are as shown below. The NMOS is MN1 and PMOS is MP1.
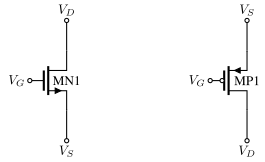
Figure 2: Transistor symbols
The MOS part of the name can be seen in MN1, where $V_{G}$ is the gate connected to a vertical line (metal), a space (oxide), and another vertical line (the silicon substrate or silicon bulk).
On the sides of the gate we have two connections, a drain $V_{D}$ and a source $V_{S}$.
If we have a sufficient voltage between gate and source $V_{GS}$, then the transistor will conduct from drain to source. If the voltage is too low, then there will not be much current.
The “source” name is because that’s where the charge carrier (electrons) come from, they come from the source, and flow towards the drain. As you may remember, the “current”, as we’ve defined it, flows opposite of the electron current, from drain to source.
The PMOS works in a similar manner, however, the PMOS is made of a different type of silicon, where the dominant charge carrier is holes in the valence band. As a result, the gate-source voltage needs to be negative for the PMOS to conduct.
In a PMOS the holes come from the source, and flow to the drain. Since holes are positive charge carriers, the current flows from source to drain.
In most MOSFETs there is no physical difference between source and drain. If you flip the transistor it would work almost exactly the same.
Field Effect
Imagine that the bulk (the empty space underneath the gate), and the source is connected to 0 V. Assume that the gate is 0 V.
In the source and drain parts of the transistor there is an abundance of free electrons that can move around, exactly like in a metal conductor, however, underneath the gate there are almost no free electrons.
There are electrons underneath the gate though, trillions upon trillions of electrons, but they are stuck in covalent bonds between the Silicon atoms, and around the nucleus of the Silicon atoms. These electrons are what we call bound electrons, they cannot move, or more precisely, they cannot contribute to current (because they do move, all the time, but mostly around the atoms).
Imagine that your eyes could see the free electrons as a blue fluorescent color. What you would see is a bright blue drain, and bright blue source, but no color underneath the gate.
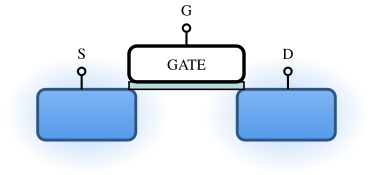
Figure 3: MOSFET in “off” state
As you increase the gate voltage, the color underneath the gate would change. First, you would think there might be some blue color, but it would be barely noticeable.
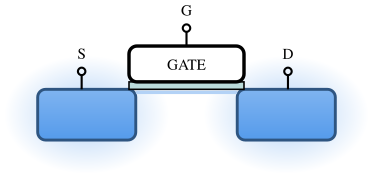
Figure 4: MOSFET in subthreshold
At a certain voltage, suddenly, there would be a thin blue sheet underneath the gate. You’d have to zoom in to see it, in reality it’s an ultra-thin, 2 dimensional electron sheet.
As you continue to increase the gate voltage the blue color would become a little brighter, but not much.
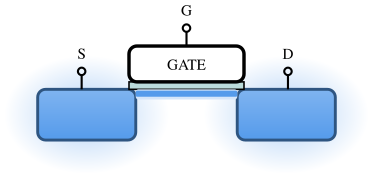
Figure 5: MOSFET in strong inversion
This thin blue sheet extends from source to drain, and create a conductive channel where the electrons can move from source to drain (or drain to source), exactly like a resistor. The conductance of the sheet is the same as the brightness, higher gate source voltage, more bright blue, higher conductance, less resistance.
Assume you raise the drain voltage. The electrons would move from source to drain proportional to the voltage. How many electrons could move would depend on the gate voltage.
If the gate voltage was low, then there is low density of electrons in the sheet, and low current.
If the gate voltage is high, then the electron density in the sheet is high, and there can be a high current, although, the electrons do have a maximum speed, so at some point the current does not change as fast with the gate voltage.
At a certain drain voltage you would see the blue color disappear close to the drain and there would be a gap in the sheet.
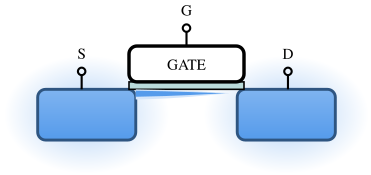
Figure 6: MOSFET in strong inversion and saturation
That could make you think the current would stop, but it turns out, that the electrons close to drain get swept across the gap because the electric field is so high from the edge of the sheet to the drain.
As you continue to increase the drain voltage, the gap increases, but the current does not really increase that much. It’s this exact feature that makes transistors so attractive in analog circuits. I can create a current from drain to source that does not depend much on the drain to source voltage! That’s why we sometimes imagine transistors as a “trans-conductance”. The conductance between drain and source depends on the voltage somewhere else, the gate-source voltage.
And now you may think you understand how the transistor works. By changing the gate voltage, we can change the electron current from source to drain. We can turn on, and off, currents, creating a 0 and 1 state.
For example, if I take a PMOS and connect the source to a high voltage, the drain to an output, and an NMOS with the source to ground and the drain to the output, and connect the gates together, I would have the simplest logic gate, an inverter, as shown below.
If the input $V_{in}$ is a high voltage, then the output $V_{out}$ is a low voltage, because the NMOS is on. If the input $V_{in}$ is a low voltage, then the output $V_{out}$ is a high voltage, because the PMOS is on.
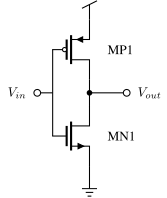
Figure 7: Inverter
I can now build more complex “logic gates”. The one below is a Not-AND gate (NAND). If both inputs (A and B) are high, then the output is low (both NMOS are on). Otherwise, the output is high.
I find it amazing that all digital computers in existence can be constructed from the NAND gate. In principle, it’s the only logic gate you need. If you actually did construct computers from NANDs only, they would be costly, and consume lots of power. There are smarter ways to use the transistors.
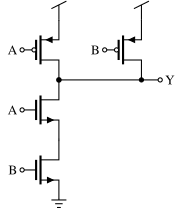
Figure 8: NAND
You may be too young to have seen the Matrix, but now is the time to decide between the red pill and the blue pill.
The red will start your journey to discover the reality behind the transistor, the blue pill will return you to your normal life, and you can continue to think that you now understand how transistors work.
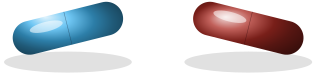
Figure 9: The choice
Because:
- Why did the area underneath the gate turn blue?
- Why is it only a thin sheet that turns blue?
- Where did the electrons for the sheet come from?
- Why did the blue color change suddenly?
- How does the brightness of the blue change with gate-source voltage?
- How can the electrons stay in that sheet when we connect the bulk to 0 V?
- Why is there not a current from the bulk (0 V) to drain?
- Why don’t the electrons jump from source to drain? It’s a gap, the same as from the sheet to drain?
And did you realize I never in this chapter explained how the field effect worked?
Someday, I may write all the details, if I ever understand it all. For now, I hope that the sections below will help you a bit.
Analog transistors in the books
In the books we learn the equations for weak inversion
\[I_D \propto e^{(V_{gs}-V_{tn})/nV_T}\], where $I_D$ is the drain current, $V_{gs}$ is the gate source voltage, $V_{tn}$ is the threshold voltage, $n$ is the slope factor (more on that later) and $V_T = kT/q$, where $k$ is Boltzmann’s constant, $T$ is the temperature in Kelvin and $q$ is the unit charge
The equation is similar to bipolar and diode equations, because the physics is the same.
The drain current in weak inversion is mostly a diffusion current and relates to the density of electrons in the conduction band (for an NMOS), which can be computed from the density of available energy states, and the Fermi-Dirac distribution.
\[n = \int_{E_C}^{\infty}N(E)\frac{1}{e^{(E-E_F)/kT}+1}dE\], where $n$ is the density of electrons in the conduction band, $N(E)$ is the density of available energy states, $E$ is the integration variable (and the energy) and $E_F$ is the Fermi-level.
Maybe the equation looks complicated, but it’s really “Multiply the available energy state with the probability of being in that state, and sum for all available energy states”.
Changing the voltage changes the number of free electrons, simply because we bring the conduction band closer to the Fermi level.
The Fermi level is just something we invented, and just means “If there was an quantum state at the Fermi level Energy, then it would have a 50 % probability of being occupied by an electron”.
In the equation above, moving the conduction band edge is equivalent to reducing the $E_C$. As such, more of the Fermi-Dirac distribution has available energy states $N(E)$, and the density of electrons $n$ in conduction band becomes higher.
In strong inversion, the MOSFET is more like a voltage controlled resistor with a conductance that is proportional to gate-source voltage.
The density of electrons increases because we bend the conduction band beyond the Fermi level, as a result, most of the available energy states in the conduction band are filled by electrons.
Electrons are only free to move, however, close to the surface of the silicon, as far away from the surface, we don’t feel the effects of the gate-source voltage, and the conduction band stays at the same energy. As a result, electrons form a 2 dimensional electron gas close to the silicon surface. What we call an inversion layer.
Once we have that electron gas, or inversion layer, we have a connection between the drain and source n-type regions, and the current can be estimated by a drift current. Parts of the diffusion current will still be there, but much smaller magnitude than the drift current, so we drop the diffusion current, and get
\[I_D = \frac{1}{2} \mu_n C_{ox}\frac{W}{L}(V_{gs}-V_{tn})^2\]The equations in the books are good to give a physical understanding of what happens. Although, we tend to forget that everybody forgets.
We teach quantum physics one year, and how to compute the density of states $N(E)$ from Schrodinger, the wave-function and Fermi-Dirac distribution.
Next year we talk about semiconductors, crystal lattice, band structure (density of states as a function of space), energy diagrams (band structure is complex, so we just use the lowest conduction band and highest valence band), doping to shift the Fermi level, and how we can create PN-junctions, bipolars and MOSFETS.
The year after we teach the current equations for MOSFETs, and the books don’t have the link back to solid-state physics, after all, we already told the students that, they should remember!
I think, quite often, we just end up with confused students. And I don’t think it’s necessary to end up with confused students. Maybe sometimes we end up with confused students because the Professors can’t necessarily remember where the equations come from either, nor how electrons and holes really behave.
It’s not necessary for an analog design student to remember how to compute the density of available energy states from Schrodinger and the wave function. If we wanted to use the Dirac equation (the relativistic wave equation, which brings in spin and the magnetic interactions properly) and the wave function to compute how a Silicon atom actually behaves, I don’t think we can. As far as I’ve been able to figure out, it’s not possible to have a closed form solution (symbolic), nor is it possible with supercomputers to do a numeric time-evolution of the states in a single Silicon atom with all the inter-particle interactions, space, momentum, spins, electric fields and magnetic fields.
But we can make sure we connect the links from Schrodinger to the MOSFET equations, the short version of that was above, but the following sections tries to explain with words how the transistor actually works.
I’m not going to give all the equations and all the maths. For that, there are excellent books and resources. I would recommend Mark Lundstrom for the best in detail description of MOSFETs.
Transistors in weak inversion
Consider the cartoon below which shows the hole concentration in the valence band, and electron concentration in the conduction band versus the x direction of the transistor.
For the moment we’ll ignore the field effect of the gate, and how that modulates the hole concentration underneath the gate.
If you’re familiar with bipolars, then you may think I’ve drawn the wrong transistor, because you see an NPN bipolar transistor. The picture is correct, however, this is how a normal MOSFET looks. It’s actually also a NPN bipolar transistor, but we don’t usually use that part (you’ll see more when we get to ESD)
In the source we’ve doped with donors, and have an abundance of free electrons. Underneath the gate, or the bulk, we have doped with acceptors, and have an abundance of holes.
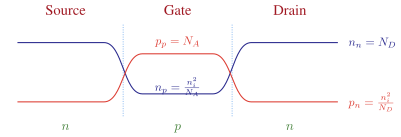
Figure 10: Charge carrier density in a MOSFET
Let’s consider electron current for now, and only look at the conduction band.
An electron in the source would see an energy barrier of $\phi_B$, and most electrons would be turned around at the barrier. Some, however, do have the energy to traverse the barrier and flow through the bulk. Not all of them would reach the bulk, due to recombination, but let’s assume the bulk is short, and all electrons injected into the bulk show up at the drain.
At the drain side they would fall down the potential barrier to the drain. The same process would happen in reverse, from drain to source.
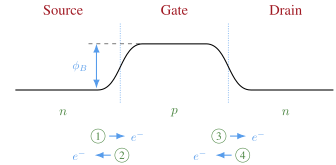
Figure 11: MOSFET subthreshold , $V_{DS} = 0$
There would also be hole currents flowing between source/bulk/drain and vice versa
Assume source and drain are at the same potential, then the sum of all currents (1,2,3,4) for both electrons and holes in Figure 11 must equal zero.
Assume that we increase the drain voltage, as shown in Figure 12. Increasing the drain voltage is the same as reducing the conduction band in the drain.
Since there now is a higher barrier from drain to bulk, it’s now much less probable that electrons are injected from drain to bulk.
Now the sum of all currents would not equal zero, as the 1 and 3 currents are larger than 2 and 4.
As such, there would be a net flow of electron current from source to drain.
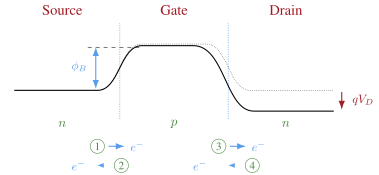
Figure 12: MOSFET subthreshold, $V_{S} = 0\text{ V}, V_D > 0\text{ V}$
Notice that if we increase the drain voltage further, then the electron injection from drain to bulk would quickly approach zero.
At that point, even though we increase the drain voltage further, the current does not really change. As the current is only now given by the barrier height at the source.
The barrier height at the source is the built in voltage of the junction, and as we’ve seen before, that voltage depends on doping concentration. If we increase the hole concentration in bulk, then we increase the barrier height, and it’s less probable that the electrons have enough energy to be injected from source to bulk.
If we only need to consider the electrons and holes at source for the subthreshold current (assuming the drain voltage is high enough), then we should expect the equation look very similar to a diode, and indeed it does.
The drain current, which is mostly a diffusion current, is given by
\[I_{D} = I_{D0} \frac{W}{L} e^{q(V_{GS} - V_{tn})/ n kT}\]where
\[n = (C_{ox} + C_{j0})/C_{ox}\] \[I_{D0} = (n - 1) \mu_n C_{ox} \left(\frac{kT}{q}\right)^2\]This is not exactly the same as the diode equation, but we can see that it looks similar. Most of the quantum mechanics is baked into the $V_{tn}$
The transconductance ($dI_D/dV_{GS}$) in weak inversion is then
\[g_m = \frac{I_D}{nV_T}\]A big difference from the diode equation is the fact that the gate-source voltage seems to determine the current, and not the voltage across the pn junction.
Transistors in strong inversion
Consider the band diagram in Figure 13, in the figure we’re looking at a cross section of the transistor. From left we’re in the gate, then we have the oxide, and then the bulk of the transistor.
We don’t see the drain and source, as the source would be towards you, and the drain would be into the picture.
The cartoon is not a real transistor. I don’t think there is necessarily a combination of semiconductor and metal where we end up with the same Fermi level ($E_F$) without some bending of the conduction band and valence band, but for illustration, let’s assume that’s the case.
We can see the Fermi level in the semiconductor is shifted towards the valence band, and thus we have a P-type semiconductor.
The gate is metallic, so it does not have a bandgap, and we assume that the Fermi level is at the conduction band edge.
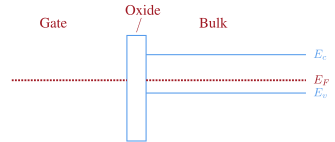
Figure 13: Band diagram of a fictive MOSFET.
Assume we increase the gate-source voltage. In a band diagram that corresponds to shifting the energy down.
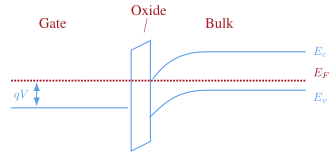
Figure 14: Band diagram with gate-source voltage applied
Moving the gate down has the effect of bending the bands in the semiconductor. We’ll lose some voltage across the oxide, but not necessarily that much.
The bending of the valence band will decrease the hole concentration close to the silicon surface, and the semiconductor will be depleted of mobile charge carriers.
The valence band bending will also reduce the barrier height in Figure 12, which increases the number of carriers that can be injected at source/bulk interface, so the subthreshold current will start to increase.
At some point, the band bending of the conduction band will become so large that the electron concentration underneath the gate will increase significantly. The gate-source voltage where the electron concentration equals the bulk hole concentration far away from the silicon surface is called the “threshold voltage”.
As you continue to increase the gate-source voltage there is a limit to how much the electron concentration increases. When the band bending of the conduction band passes the Fermi level, then over 50 percent of the available states in the conduction band are filled with electrons.
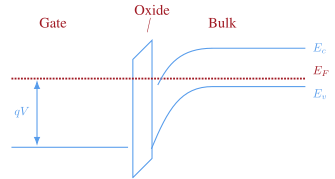
Figure 15: Band diagram with high gate-source voltage applied
The conditions to be in strong inversion is that the gate/source voltage is above some magic values (threshold voltage), and then some.
The quantum state of the electron is fully determined by its spin, momentum and position in space. How those parameters evolve with time is determined by the Schrodinger equation. In the general form
\[i\hbar\frac{d}{dt}\Psi(r,t) = \widehat{H} \Psi(r,t)\]The Hamiltonian ($H$) is an “energy matrix” operator and may contain terms both for the momentum and Coulomb force (electric field) experienced by the system.
But what does the Schrodinger equation tell us? Well, the equation above does not tell me much, it can’t be “solved”, or rather, it does not have a single solution. It’s more a framework for how the wave function, and the Hamiltonian, describes the quantum states of a system, and the probability amplitudes of transition between states.
The Schrodinger equation describes the time evolution of the bound electrons shared between the Silicon atoms, and the fact that applying an electric field to silicon can free electrons from covalent bonds.
As the gate-source voltage increases the wave function that fits in the Schrodinger equation predicts that the free electrons will form a 2d sheet underneath the gate. The thickness of the sheet is only a few nano meters.
In Figure 2 of the paper
Carrier transport near the Si/SiO2 interface of a MOSFET
you can see how the free electron density is located underneath the gate.
Figure 16 draws the same story from the equations. The gate field bends the conduction band into a narrow well against the oxide, and a well that narrow does what wells do in quantum mechanics: it quantizes the motion across it. The electrons can only occupy discrete subbands in the depth direction, and at room temperature almost all of them sit in the lowest one, $E_0$. What the wave function of that subband says is drawn below the band diagram: the probability of finding an electron is zero right at the interface - the oxide barrier forbids it - rises to a peak a nanometre or two into the silicon, and has died away by about five.
That distribution is the “2d sheet”. The electrons are free to move along the channel, which is the current we design with, and pinned in depth, which is why the sheet has a thickness at all. It also explains a number you meet later: the inversion charge does not sit exactly at the surface, so the effective oxide thickness is a little larger than the physical one.
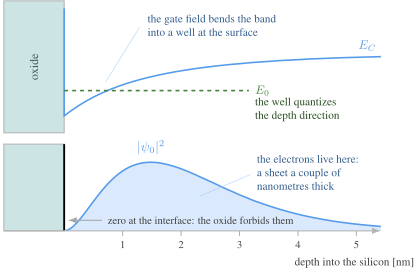
Figure 16: The inversion layer in depth. Above: the gate field bends the conduction band into a well at the oxide interface, and the well quantizes motion in the depth direction into subbands. Below: the probability density of the lowest subband - zero at the interface, peaking a nanometre or two in, gone by about five. That is the “2d sheet”
I would really recommend that you have a look at Mark Lundstrom’s lecture series on Essentials of MOSFETs. It’s the most complete description of electrons in MOSFET’s I’ve seen
Introduction to behavior
Let’s assume we know nothing about how transistors work, but we do know how to simulate them in ngspice.
We could sit down, and try and figure out how the transistors work.
You can find the testbenches at Testbenches at dicex/sim/spice/NCHIO
Drain Source Current
Let’s see what happens to the drain to source current when we change the voltages. We would expect the drain to source current to change as a function of the drain to source, $V_{DS}$, and gate to source $V_{GS}$ voltages. Or mathematically
\[I_{DS} = f(V_{GS},V_{DS},...)\]or symbolically
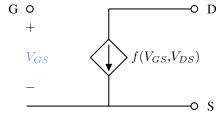
Figure 17: Large signal model
The drain current is a voltage controlled current source $f(V_{GS},V_{DS})$.
The symbolic model above is what we call a “Large Signal Model”. We could expand the function above to
\[I_{DS} = f(V_{GS},V_{DS}) = G_m(V_{GS},V_{DS},I_{DS}) V_{GS} + G_{ds}(V_{GS},V_{DS},I_{DS}) V_{DS}\], where the $G_m$ is a trans-conductance (the current depends on a voltage somewhere else), and $G_{ds}$ is a conductance (current depends on the voltage across the conductance).
Even now we can see that the model above is complicated. The transconductance and conductance of the transistor is a function of the other voltages, and the output current. It’s a non-linear system!
If the transistor was linear, then we would expect that the current increased proportionally to gate/source voltage, but how does the current look when we change the gate source voltage?
Gate-source voltage
Below are the conditions I’ve used in the testbench. Notice there is a $V_{B}$ that is the $p-$ substrate, or bulk, of the transistor. When we draw symbols of a transistor we don’t always include the bulk node, because that’s most of the time connected to ground for NMOS.
But sometimes, we connect the bulk to another voltage, so the bulk terminal will be in our schematics.
| Param | Voltage |
|---|---|
| VGS | 0 to 1.8 |
| VDS | 1.0 |
| VS | 0 |
| VB | 0 |
In the plot below we can see the sweep of the gate voltage.
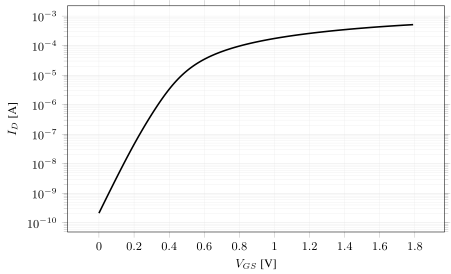
Figure 18: Simulated $I_{DS}$ versus $V_{GS}$ at $V_{DS}$ = 1 V
Notice the log y-axis. In weak inversion the current is exponential in $V_{GS}$ - a straight line on a log axis - and above the threshold voltage the curve bends over into the square-law, and eventually velocity-saturated, behavior. The current changes by many orders of magnitude, which is why the same transistor can be both a decent switch and an amplifier.
Inversion level
The curve above spans six orders of magnitude, so “the” operating region of a MOSFET does not exist - there are three, and they are named by how inverted the channel is.
Define $V_{eff} \equiv V_{GS} - V_{tn}$ , where $V_{tn}$ is the “threshold voltage”
| Veff | Inversion level |
|---|---|
| less than 0 | weak inversion or subthreshold |
| 0 | moderate inversion |
| more than 100 mV | strong inversion |
The single most useful voltage to think in is not $V_{GS}$, but the effective voltage $V_{eff} = V_{GS} - V_{tn}$: how far above (or below) the threshold voltage we are. It tells us which physics dominates. Below threshold the current is diffusion over a barrier and exponential in $V_{eff}$. Well above threshold we have a proper inversion layer and drift current. And in between, in moderate inversion, both mechanisms matter at the same time.
Weak inversion
The drain current is low, but not zero, when
\[V_{eff} << 0\] \[I_{DS} \approx I_{D0} \frac{W}{L} e^{V_{eff}/n V_{T}} \text{ if } V_{DS} > 3 V_{T}\] \[n \approx 1.5\]This is the same equation we derived from the barrier picture earlier, now with the condition $V_{DS} > 3V_T$ made explicit: once the drain is a few thermal voltages below the barrier, injection from the drain side has died out and the current stops caring about $V_{DS}$. The slope factor $n$ is the capacitive division between the oxide capacitance and the depletion capacitance - the gate does not get to move the surface potential one-to-one - and lands around 1.5 in this process.
Moderate inversion
Very useful region in real designs. Hard for hand-calculation. Trust the model.
I’m serious about “very useful”: a large fraction of well-designed analog transistors end up biased around moderate inversion, because it buys most of the $g_m/I_D$ of weak inversion at a fraction of the area and parasitics. And I’m equally serious about “trust the model”: neither the exponential nor the square-law expression is right here, so hand calculation can only bracket the answer. Set up the bias with the simulator, and use the hand expressions to sanity-check the trend.
Strong inversion
\[I_{DS} = \mu_n C_{ox} \frac{W}{L} \begin{cases} V_{eff} V_{DS} & \text{if }V_{DS} << V_{eff} \\[15pt] V_{eff} V_{DS} - V_{DS}^2/2 & \text{if } V_{DS} < V_{eff} \\[15pt] \frac{1}{2} V_{eff}^2 & \text{if } V_{DS} > V_{eff} \\[15pt] \end{cases}\]Three cases, one story. For tiny $V_{DS}$ the channel is a uniform resistor and the current is linear in both voltages. As $V_{DS}$ grows the drain end of the channel gets less gate-to-channel voltage, so the channel thins there and the $-V_{DS}^2/2$ term bends the curve over. And at $V_{DS} = V_{eff}$ the drain end pinches off entirely: past that point the current is set by the channel alone and stops (mostly) caring about the drain.
To see where the equations come from it helps to watch the carriers. The cross-sections below walk the gate voltage up from negative to positive before we do the same with the drain.
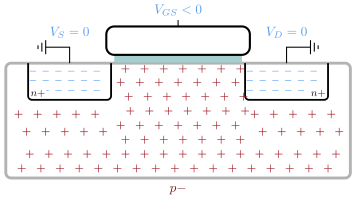
Figure 19: Accumulation, $V_{GS} < 0$
What we’re seeing here are the free charges - the mobile carriers, not the fixed dopant ions. Electrons (blue) are free to move around in the $n+$ source and drain, holes (red) in the $p-$ bulk. Where the mobile carriers are present in their equilibrium numbers the material is quasi-neutral: behind each free carrier sits an ionized donor or acceptor locked in the lattice, and the two cancel.
That is not true everywhere, and the exceptions are where the interesting physics lives. Sweep the mobile carriers out of a region - at the source/bulk and drain/bulk junctions, and under the gate once it starts to deplete - and the ionized dopants are left behind uncompensated. That leftover space charge is not neutral, and by Gauss it must produce a field: this is the depletion region, and its field is what holds the junction in equilibrium and what sweeps carriers across it. Keep the distinction in mind while reading the next few figures: they draw the mobile carriers, so a region drawn empty is not a region with no charge - it is a region whose charge is the fixed dopant ions, with a field across it.
With a negative gate-source voltage the holes are attracted to the surface and accumulate underneath the gate.
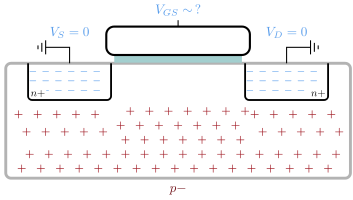
Figure 20: Depletion
Raising the gate voltage pushes the holes away from the surface. The region underneath the gate is depleted of mobile carriers - only the fixed, negatively charged acceptor ions remain.
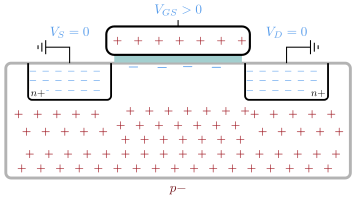
Figure 21: Weak inversion
Positive charge on the gate mirrors negative charge in the silicon. The depletion region grows, the barrier between source and bulk shrinks, and the first few electrons make it into the channel region - the exponential subthreshold current from earlier.
And this is where the threshold voltage gets its definition: $V_{tn}$ is the gate-source voltage where the electron concentration at the surface equals the hole concentration in the bulk, $p_p = n_{ch}$. Nothing physically dramatic happens at exactly that voltage - the electron concentration is exponential in surface potential either side of it - but it’s a well-defined line in the sand, and every equation in this chapter leans on it.
Now hold the gate at a fixed 0.5 V - a little above threshold - and sweep the drain instead.
Drain source voltage
The table shows the bias: gate fixed a little above threshold, drain swept from 0 V to 1.8 V. Watch the current in Figure 22 as the drain rises - the curve has two personalities, and the boundary between them is $V_{eff}$.
| Param | Voltage [V] |
|---|---|
| VGS | 0.5 |
| VDS | 0 to 1.8 |
| VS | 0 |
| VB | 0 |
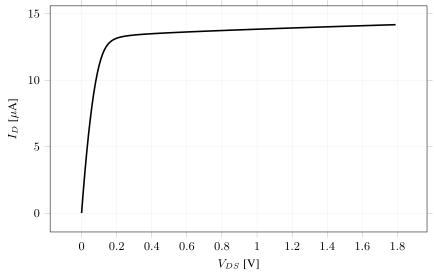
Figure 22: Simulated $I_{DS}$ versus $V_{DS}$ at $V_{GS}$ = 0.5 V
For small $V_{DS}$ the transistor behaves like a resistor - the current is proportional to the voltage. Beyond $V_{DS} \approx V_{eff}$ the current flattens: the transistor is in saturation, and only the weak slope from channel length modulation (and DIBL) remains.
Strong inversion
The measured curve is captured by one equation with three cases, split on how $V_{DS}$ compares to $V_{eff}$. Read each case together with Figures 22 to 24, which show what the inversion layer is doing in that region.
\[I_{DS} = \mu_n C_{ox} \frac{W}{L} \begin{cases} V_{eff} V_{DS} & \text{if }V_{DS} << V_{eff} \\[15pt] V_{eff} V_{DS} - V_{DS}^2/2 & \text{if } V_{DS} < V_{eff} \\[15pt] \frac{1}{2} V_{eff}^2 & \text{if } V_{DS} > V_{eff} \\[15pt] \end{cases}\]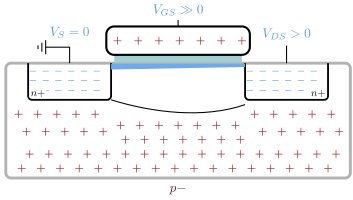
Figure 23: Triode, $V_{DS} \ll V_{eff}$
The inversion layer reaches all the way from source to drain, and the transistor behaves like a gate-voltage controlled resistor.
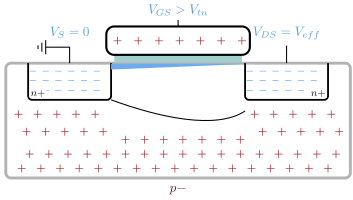
Figure 24: Pinch-off, $V_{DS} = V_{eff}$
The local gate-to-channel voltage at the drain end is down to $V_{tn}$, so the inversion layer just barely disappears at the drain.
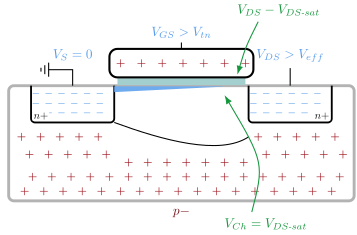
Figure 25: Saturation, $V_{DS} > V_{eff}$
The pinch-off point, where the channel voltage equals $V_{DS,sat}$, moves slightly towards the source as $V_{DS}$ increases.
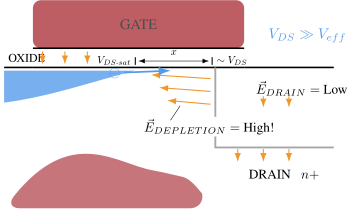
Figure 26: Close-up of the drain end in saturation
Between the end of the inversion layer and the drain there is no channel, but there is a strong lateral field across the depleted gap. Electrons that reach the pinch-off point are swept across to the drain, which is why the current does not stop at pinch-off. The length of the gap grows slightly with $V_{DS}$, which shortens the effective channel - channel length modulation.
Low frequency model
The curves so far are large signal: the actual currents and voltages. An amplifier works on small wiggles around a bias point, and for those we linearize. Two derivatives are all we keep at low frequency: how much drain current a gate wiggle gives, $g_m$, and how much the drain voltage steals back, $g_{ds}$. Figure 26 is those two derivatives drawn as a circuit.
\[g_{m} = \frac{\partial I_{DS}}{\partial V_{GS}}\] \[g_{ds} = \frac{1}{r_{ds}} = \frac{\partial I_{DS}}{\partial V_{DS}}\]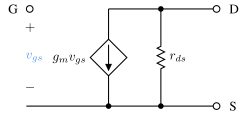
Figure 27: Low frequency small signal model
For small perturbations around an operating point the transistor is just two elements: a transconductance $g_m v_{gs}$ and an output resistance $r_{ds}$.
Now put the square law into the two derivatives, starting with $g_m$. A little algebra gives the same transconductance in three different currencies:
Transconductance
Define $\ell = \mu_n C_{ox} \frac{W}{L}$ and $V_{eff} = V_{GS} - V_{tn}$
$I_{D} = \frac{1}{2} \ell (V_{eff})^2$ and $V_{eff} = \sqrt{\frac{2I_{D}}{\ell}}$ and $\ell = \frac{2I_D}{V_{eff}^2}$
\[g_m = \frac{ \partial I_{DS}} {\partial V_{GS}} = \ell V_{eff} = \sqrt{2 \ell I_{D}}\] \[g_m = \ell V_{eff} = 2 \frac{I_D}{V_{eff}^2} V_{eff} = \frac{2 I_D}{V_{eff}}\]The same $g_m$ written three ways, and each is useful for a different question. $g_m = \ell V_{eff}$ answers “what does another 100 mV of gate drive buy me”. $g_m = \sqrt{2\ell I_D}$ answers “what does another micro amp buy me” - only square-root much, which is why burning current for bandwidth gets expensive. And $g_m = 2I_D/V_{eff}$ is the designer’s favorite, because it needs no process constants at all: pick a current and an effective voltage, and the transconductance follows.
For the output conductance we need the piece the ideal square law leaves out: let the current grow linearly with $V_{DS}$ through a channel length modulation term $\lambda$, and differentiate.
Define $\ell = \mu_n C_{ox} \frac{W}{L}$ and $V_{eff} = V_{GS} - V_{tn}$
\[I_D = \frac{1}{2} \ell V_{eff}^2\left[1 + \lambda (V_{DS} - V_{eff})\right]\] \[\frac{1}{r_{ds}} = g_{ds} = \frac{ \partial I_D}{\partial V_{DS} } = \lambda \frac{1}{2} \ell V_{eff}^2\]Assume channel length modulation is not there, then
$I_D = \frac{1}{2} \ell V_{eff}^2$ which means $\frac{1}{r_{ds}} = g_{ds} \approx \lambda I_D$
$\lambda$ is the channel length modulation parameter: the pinch-off point in Figure 26 creeps towards the source as $V_{DS}$ grows, the effective channel shortens, and the current rises a little. The practical consequences: the output resistance is inversely proportional to the current you run, and since $\lambda$ shrinks with channel length, a longer transistor is the cheapest way to buy output resistance.
The two derivatives combine into the most important figure of merit of a single transistor: the largest voltage gain it can possibly give you.
Intrinsic gain
Define intrinsic gain as
\[A = \left\vert \frac{v_{out}}{v_{in}}\right\vert = g_m r_{ds} = \frac{g_m}{g_{ds}}\] \[A = \frac{2 I_D}{V_{eff}} \times \frac{1}{ \lambda I_D } = \frac{2}{\lambda V_{eff}}\]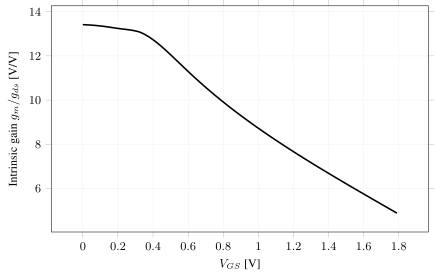
Figure 28: Simulated intrinsic gain versus gate-source voltage (the x-axis, vgaini, is $V_{GS} = V_{eff} + V_{tn}$)
The intrinsic gain falls as $V_{eff}$ increases, as the $2/(\lambda V_{eff})$ expression predicts. If you need gain, don’t burn all your headroom on effective voltage.
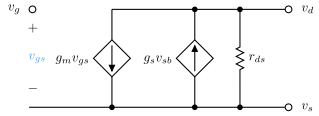
Figure 29: Small signal model with the bulk transconductance
The bulk is a back-gate: if source and bulk move relative to each other, the threshold voltage - and hence the current - changes, which the $g_s v_{sb}$ source models.
Body effect
How strongly the back-gate acts has a name: the body effect coefficient $\gamma$, and it comes straight from the capacitive divider between the gate oxide and the depletion region under the channel.
\[V_{tn} = V_{t0} + \gamma\left(\sqrt{2\phi_F + V_{SB}} - \sqrt{2\phi_F}\right)\] \[\gamma = \frac{\sqrt{2 q N_A \epsilon_{si}}}{C_{ox}}\] \[g_{s} = \frac{\partial I_{DS}}{\partial V_{SB}} \approx (n - 1) g_m \approx 0.2 g_m\]Reverse bias the source-bulk junction and the depletion region under the channel widens. The extra depletion charge must be imaged on the gate, so the threshold voltage rises - that is the square root above. The small signal version is the $g_s$ source in Figure 29, roughly a fifth of $g_m$. It is a parasitic in a source follower, and a free extra input if you drive the bulk on purpose - a trick the OTA chapter returns to.
High frequency model
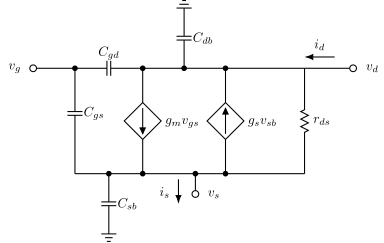
Figure 30: High frequency small signal model
The four capacitances $C_{gs}$, $C_{gd}$, $C_{sb}$ and $C_{db}$ set the poles and zeros at high frequency.
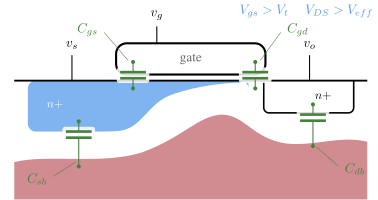
Figure 31: Where the capacitances live in the device
$C_{gs}$ and $C_{gd}$ are oxide (and overlap) capacitances, while $C_{sb}$ and $C_{db}$ are depletion capacitances of the reverse biased source and drain junctions.
The gate capacitances first. How the gate charge splits between source and drain depends on the region of operation:
$C_{gs}$ and $C_{gd}$
\[C_{gs} = \begin{cases} WLC_{ox} & \text{if }V_{DS} = 0 \\[15pt] \frac{2}{3}WLC_{ox} & \text{if }V_{DS} > V_{eff} \\[15pt] \end{cases}\] \[C_{gd} = C_{ox} W L_{ov}\]In triode the channel is uniform and the whole gate area capacitance $WLC_{ox}$ splits evenly between source and drain. In saturation the drain end is pinched off - the channel charge lives mostly at the source end - and integrating the charge distribution gives the famous $\frac{2}{3}$. $C_{gd}$ then keeps only the overlap capacitance $C_{ox} W L_{ov}$, where $L_{ov}$ is the small distance the drain diffusion pokes in underneath the gate. Small, but as the Miller section shows, not harmless.
$C_{sb}$ and $C_{db}$
Both are depletion capacitances
\[C_{sb} = (A_s + A_{ch}) C_{js}\] \[C_{js} = \frac{C_{j0}}{\sqrt{1 + \frac{V_{SB}}{\Phi_0}}}\] \[\Phi_0 = V_T ln\left(\frac{N_A N_D}{n_i^2}\right)\] \[C_{db} = A_d C_{jd}\] \[C_{jd} = \frac{C_{j0}}{\sqrt{1 + \frac{V_{DB}}{\Phi_0}}}\]The source and drain diffusions sit in reverse biased junctions to the bulk, and a reverse biased junction is a capacitor whose plates are the depletion edges. More reverse bias, wider depletion, smaller capacitance - hence the square root. $A_s$ and $A_d$ are the junction areas (the source side includes the channel area $A_{ch}$), and $\Phi_0$ is the built-in voltage we met in the diode chapter.
Be careful with Cgd (blame Miller)
Of the four capacitances, $C_{gd}$ is the smallest on paper - just the overlap - and the most dangerous in practice. The reason is where it sits: between the input and the output of an amplifying stage. Look at the left of Figure 31: a common source stage with a current source load, gain $A = -g_m r_{d}$ from gate to drain, and $C_{gd}$ strapped across exactly that gain.
Why that matters is Miller’s theorem, sketched in the dashed frame on the right of the figure. Take any admittance $Y$ connected around an inverting amplifier $-A$. Wiggle the input by $v$: the output moves by $-Av$, so the voltage across $Y$ is $(1+A)v$, and the input has to supply $(1+A)$ times the current it would if $Y$ simply went to ground. The feedback element can therefore be replaced by two grounded ones,
If $Y(s) = 1/sC$ then $Y_1(s) = 1/sC_{in}$ and $Y_2(s) = 1/sC_{out}$ where $C_{in} = (1 + A) C$, $C_{out} = (1 + \frac{1}{A})C$
\[C_{in} \approx C_{gd}\, g_{m} r_{ds}\]$C_{gd}$ can appear to be 10 to 100 times larger!
if gain from input to output is large
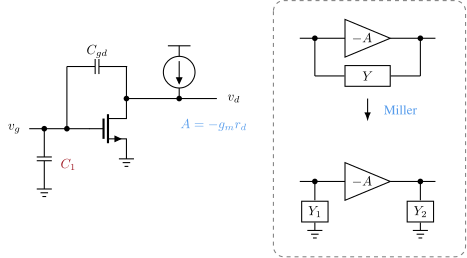
Figure 32: Miller’s theorem applied to $C_{gd}$
For the capacitor this means the input sees $C_{in} = (1+A)C$, drawn as $C_1$ at the gate in the figure, while the output sees a nearly unchanged $C_{out} = (1+1/A)C$. With $C = C_{gd}$ and $A = g_m r_{ds}$, the gate is loaded by $C_{gd}$ multiplied by the stage gain - 10 to 100 times the overlap capacitance you read from the layout. This is why the input pole of a high-gain stage is so often set by its smallest capacitor.
Transit frequency
The high frequency model rolls up into a single speed metric: the frequency where the current gain of the transistor falls to one. Drive the gate with a current and ask when the gate capacitance eats all of it:
\[f_T = \frac{g_m}{2 \pi (C_{gs} + C_{gd})}\]In strong inversion, with $C_{gs} \approx \frac{2}{3} W L C_{ox}$:
\[f_T \approx \frac{3 \mu_n V_{eff}}{4 \pi L^2} \propto \frac{V_{eff}}{L^2}\]$f_T$ is why we scale: halve the length and the transistor is four times faster, until velocity saturation takes one of the two factors back. In a nanoscale process $f_T$ reaches hundreds of gigahertz - but look at the trade: the $V_{eff}$ that buys speed is the same $V_{eff}$ that sells intrinsic gain in Figure 28. Fast and high gain is not on the menu, at least not in one transistor.
Weak inversion
If $V_{eff} < 0$ diffusion currents dominate.
Back to weak inversion, now wearing the model hat rather than the physics hat. Everything is the barrier picture from the first half of this chapter, compressed into three constants: $V_T$ sets the exponential slope, $n$ the capacitive division, and $I_{D0}$ collects the rest.
\(I_{D} = I_{D0} \frac{W}{L} e^{V_{eff} / n V_T}\), where
$V_T = kT/q$, $n = (C_{ox} + C_{j0})/C_{ox}$
\[I_{D0} = (n - 1) \mu_n C_{ox} V_T^2\] \[g_m = \frac{I_D}{nV_T}\]
Figure 33: Weak inversion again, beside the equations it produces: the gate has depleted the surface and the first electrons are arriving, which is the exponential regime the three constants describe
Differentiate an exponential and you get the exponential back, divided by $nV_T$: in weak inversion the transconductance is proportional to the current, full stop. No $W/L$, no mobility, no $C_{ox}$ - just current and temperature. That is as good as $g_m$ per current gets in a MOSFET, and it is the reason the next slide’s ratio flattens out on the left.
The two regions can be compared on one axis: how much transconductance a microampere buys.
Bang for the buck
Subthreshold:
\[\frac{g_m}{I_D} = \frac{1}{nV_T} \approx 25.6 \text{ [S/A] @ 300 K}\]Strong inversion:
\[\frac{g_m}{I_D} = \frac{2}{V_{eff}}\]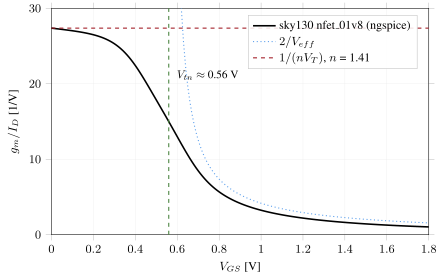
Figure 34: Simulated $g_m/I_D$ of a sky130 nfet_01v8 (gmid.py)
The transconductance per unit current is the “bang for the buck” of a transistor, and the figure shows both hand-calculation limits on top of the simulated curve. In weak inversion the measured curve flattens at $1/(nV_T)$
- the subthreshold slope of this device gives $n \approx 1.4$, about 27 S/A. In strong inversion it follows $2/V_{eff}$. In between, in moderate inversion, neither hand expression is right - the $2/V_{eff}$ asymptote overestimates by a wide margin - which is exactly why the advice earlier was to trust the model there. If you want the most $g_m$ for your current, bias weak; if you want speed and matching, bias strong; most real analog ends up somewhere on the knee.
Velocity saturation
Electron speed limit in silicon
\[v \approx 10^7 cm/s\] \[v = \mu_n E = \mu_n \frac{dV}{dx}\]\(\mu_n \approx 100 \text{ to } 600 \text{ } cm^2/Vs\) in nanoscale CMOS
The mobility model says velocity is proportional to field. But carriers in silicon scatter off the lattice, and above roughly $10^7$ cm/s more field just means more scattering, not more speed. Shrink $L$ at constant voltage and the lateral field $V/L$ grows without bound - at 1 V the mobility model crosses the speed limit just below half a micrometer, which is why every modern process lives with velocity saturation.
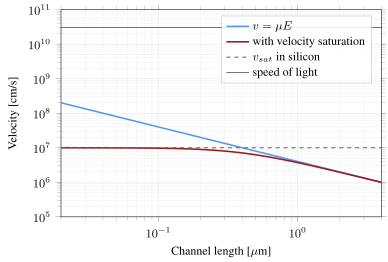
Figure 35: Carrier velocity at 1 V across the channel: the mobility model, what the carriers actually do, and the physical speed limits
Shrink the channel at a fixed voltage and the lateral field, and thus the mobility-model velocity (blue), grows without bound - it crosses the silicon speed limit long before it crosses anything relativistic. Real carriers cannot do that: the red curve saturates at $v_{sat}$, so in short channels the current becomes closer to linear, rather than quadratic, in $V_{eff}$.
Where does the square law actually come from? Charge, times width, times velocity - integrated along the channel:
Square law model
\[Q(x) = C_{ox}\left[V_{eff} - V(x)\right]\] \[v = \mu_n E = \mu_n \frac{dV}{dx}\] \[\ell = \mu_n C_{ox} \frac{W}{L}\] \[I_{D} = W Q(x) v = \ell L \left[ V_{eff} - V(x)\right] \frac{dV}{dx}\] \[I_{D} dx = \ell L \left[ V_{eff} - V(x)\right] dV\] \[I_{D} \int_0^L{dx} = \ell L \int_0^{V_{DS}}{\left[ V_{eff} - V(x)\right] dV}\] \[I_{D} \left[x\right]_0^L = \ell L \left[V_{eff}V - \frac{1}{2}V^2\right]_0^{V_{DS}}\] \[I_{D} L = \ell L \left[V_{eff}V_{DS} - \frac{1}{2} V_{DS}^2\right]\] \[@ V_{DS} = V_{eff} \Rightarrow I_{D} = \frac{1}{2} \ell V_{eff}^2\]This is the derivation behind the square law, and it is worth reading once in your life. The local channel charge is $Q(x) = C_{ox}[V_{eff} - V(x)]$ - less charge where the channel voltage has climbed - the current is charge times width times velocity, and since the same $I_D$ must flow through every slice of the channel, integrating from source to drain turns the local statement into $I_D = \ell\,[V_{eff}V_{DS} - V_{DS}^2/2]$. Evaluate at $V_{DS} = V_{eff}$ and the familiar $\frac{1}{2}\ell V_{eff}^2$ falls out. Every assumption in this chain - constant mobility, gradual channel, charge proportional to local voltage - is something a short-channel transistor violates.
Mobility Degradation
The square law assumes the mobility is a constant. It is not - two mechanisms drag it down as the gate drive grows, and the model needs a correction factor.
Multiple effects degrade mobility
- Velocity saturation
- Vertical fields reduce channel depth => more charge-carrier scattering
From square law \(g_{m} = \frac{\partial I_{D}}{\partial V_{GS}} = \ell V_{eff}\)
With mobility degradation \(g_{m(mob-deg)} = \frac{\ell}{2 \theta}\)
Velocity saturation is one of several effects that make the effective mobility fall as we crank $V_{eff}$: the vertical field also squeezes the carriers against the rough oxide interface where they scatter more. The fitting function above captures the trend, and its punchline is the last equation: push $V_{eff}$ hard enough and $g_m$ stops growing entirely at $\ell/2\theta$. Past that point, extra gate drive costs headroom and buys nothing.
What about holes (PMOS)
Everything so far used the NMOS. The PMOS is the same device upside down: the carriers are holes, and holes are slower.
In PMOS holes are the charge-carrier (electron movement in valence band)
\[\mu_p < \mu_n\]In intrinsic silicon: \(\mu_n \leq 1400 [cm^2/Vs] = 0.14 [m^2/Vs]\) \(\mu_p \leq 450 [cm^2/Vs] = 0.045 [m^2/Vs]\)
\[\mu_n \approx 3\mu_p\]Saturation velocity (same as the electron speed limit above):
\(v_{n\_sat} \approx 1.0 \times 10^5 [m/s]\) \(v_{p\_sat} \approx 0.8 \times 10^5 [m/s]\)
Don’t confuse it with the thermal velocity $\approx 2.3 \times 10^5$ m/s
Doping reduces the mobility as well: every ionized donor or acceptor is a charged scattering center, so a heavily doped channel is a slower channel.
Everything in this chapter holds for the PMOS with the signs flipped - and one important asymmetry: holes move by electrons shuffling between bonds in the valence band, and are roughly three times slower than conduction band electrons. That factor shows up everywhere: for the same current and $V_{eff}$ a PMOS is about three times wider, with correspondingly larger capacitances. It is also why the NMOS usually gets the signal path and the PMOS the loads - though in some modern strained processes the gap has narrowed to less than a factor of two.
OTHER
As we make transistors smaller, we find new effects that matter, and that must be modeled.
which is an opportunity for engineers to come up with cool names
The square law is a long-channel story. Below a micrometer or so, and especially below 100 nm, a zoo of second-order effects grows to first order. The point of this section is not that you memorize each one - the foundry’s model team already did - but that you recognize the names when they show up in a design review, and know which knob (length, layout, bias) each one responds to. The paper below is a fine map of the zoo.
Analog Circuit Design in Nanoscale CMOS Technologies 1 – ieeexplore.ieee.org/document/5247174
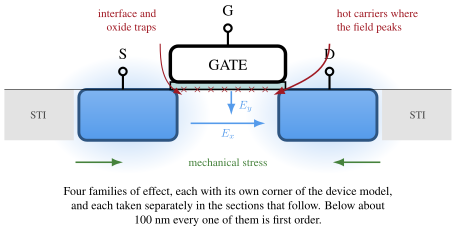
Figure 36: Four families of short-channel effect on one cross-section - mechanical stress from the isolation trenches, the transverse and lateral fields in the channel, traps at the oxide interface, and hot carriers where the lateral field peaks near the drain
The annotations - stress components, fields, trap densities and proximity effects - are all things that measurably change the current of a modern transistor, and each has its own corner of the device model.
Drain induced barrier lowering (DIBL)
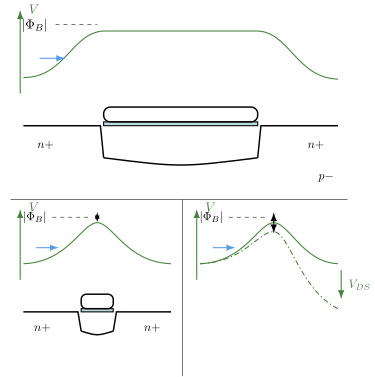
Figure 37: Drain induced barrier lowering
In a long channel (top) the source barrier $\Phi_B$ has a wide, flat top and the drain is far away. In a short channel (bottom left) the barrier is a narrow peak, and pulling the drain potential down (bottom right, dashed) also pulls the top of the barrier down. A lower barrier means more current at the same gate voltage: the threshold voltage effectively drops as $V_{DS}$ increases, which degrades the output resistance.
Well Proximity Effect (WPE)
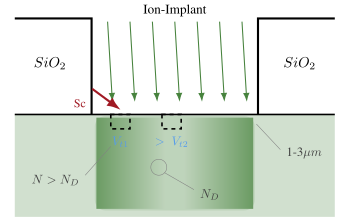
Figure 38: Well proximity effect
During the well implant, ions scatter off the edge of the photoresist and land in the silicon close to the well edge. Transistors within a micrometer or three of the well edge therefore see higher doping, and thus a higher threshold voltage, than identical transistors in the middle of the well.
Stress effects
Silicon is piezoresistive: squeeze it and the mobility changes. The table summarizes which direction of squeeze helps which device, and Figure 37 defines the three directions.
| Stress | PMOS | NMOS |
|---|---|---|
| Stretch Fz | Good | Good |
| Compress Fy | OK | Good |
| Compress Fx | Good | Bad |
What can change stress?
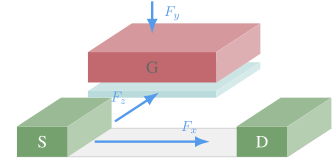
Figure 39: Mechanical stress components on the channel
Stress changes mobility, so anything that changes the stress - shallow trench isolation, nearby devices, metal fill, even the package - changes the current. The table shows the direction dependence: $F_y$ is vertical, $F_x$ along the current, $F_z$ along the width.
Gate current
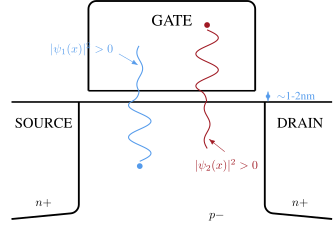
Figure 40: Gate tunneling current
With an oxide only 1-2 nm thick, the electron wave function does not stop at the oxide: $\psi(x)$ is non-zero on the other side, so carriers tunnel between channel and gate. The gate is no longer a perfect insulator, which matters for sample-and-holds and anything with high impedance nodes.
Hot carrier injection
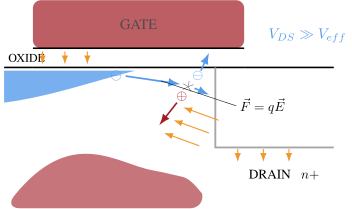
Figure 41: Hot carrier injection
In saturation the field across the pinched-off region near the drain is high. Carriers accelerated by it ($F = qE$) can gain enough energy to create electron-hole pairs by impact ionization, and some are injected into the oxide, where they damage the interface or get trapped and shift the threshold voltage over the product lifetime.
Channel initiated secondary-electron (CHISEL)
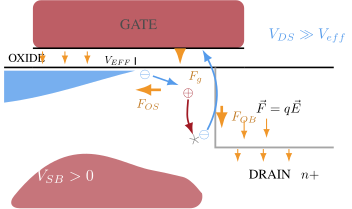
Figure 42: Channel initiated secondary electrons
With a reverse biased bulk ($V_{SB} > 0$), holes generated by impact ionization near the drain are accelerated into the bulk and can generate secondary electrons, which the vertical field can inject into the gate oxide - the same damage mechanism as hot carriers, opened up by the bulk bias.
Variability
For the rest of the chapter we leave the single ideal transistor behind and ask the question that actually decides whether circuits work: what happens when you make two of them? The vehicle is deliberately humble - a current mirror that is supposed to copy 1 uA - because every mechanism that breaks the copy also breaks amplifiers, converters and references, just with more algebra in the way.
Provide $I_2 = 1 \mu A$
Let’s use off-chip resistor $R$, and pick $R$ such that $I_1 = 1 \mu A$
Use $\frac{W_1}{L_1} = \frac{W_2}{L_2}$
What makes $I_2 \ne 1 \mu A$?
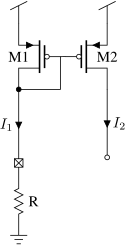
Figure 43: Current mirror with an off-chip reference resistor
The rest of this section asks a deceptively simple question about this circuit: what makes $I_2$ deviate from the ideal 1 uA?
- Voltage variation
- Systematic variations
- Process variations
- Temperature variation
- Random variations
- Noise
Voltage variation
Start with the most obvious dependency: the supply sits in the loop that sets the reference current.
\[I_1 = \frac{V_{DD} - V_{GS1}}{R}\]If $V_{DD}$ changes, then current changes.
Fix: Keep $V_{DD}$ constant
The reference current is set by the resistor, and the resistor sees $V_{DD} - V_{GS}$. Nothing about the mirror rejects a change in supply - the “fix” really is to regulate the supply, or, as the reference chapter shows, to build a current source that never lets $V_{DD}$ into the equation in the first place.
Systematic variations
Next come the errors we design in ourselves: any asymmetry between the two transistors turns into a current error. The list below is long, and every line on it is avoidable.
If $V_{DS1} \ne V_{DS2} \rightarrow I_1 \ne I_2$
If layout direction of $M_1 \ne M_2 \rightarrow I_1 \ne I_2$
If current direction of $M_1 \ne M_2 \rightarrow I_1 \ne I_2$
If $V_{S1} \ne V_{S2} \rightarrow I_1 \ne I_2$
If $V_{B1} \ne V_{B2} \rightarrow I_1 \ne I_2$
If $WPE_{1} \ne WPE_{2} \rightarrow I_1 \ne I_2$
If $Stress_{1} \ne Stress_{2} \rightarrow I_1 \ne I_2$ …
Every line above is the same statement: the two transistors only copy the current if they see the same everything. Different $V_{DS}$ is channel length modulation and DIBL; different orientation or current direction is mobility anisotropy and asymmetric implants; different surroundings are WPE and stress from the previous section. These are systematic errors: the simulator with the right layout-aware models will show them, and matched layout - same orientation, same environment, dummies, common centroid - removes them. They cost area and care, not luck.
Process variations
Even a perfectly symmetric layout cannot save the absolute value of the current, because the process constants themselves move from lot to lot. Write out the current and look at what is inside it:
Assume strong inversion and active $V_{eff} = \sqrt{\frac{2}{\mu_p C_{ox} \frac{W}{L}} I_1}$, $V_{GS} = V_{eff} + V_{tp}$
\[I_1 = \frac{V_{DD} - V_{GS}}{R} = \frac{V_{DD} - \sqrt{\frac{2}{\mu_p C_{ox} \frac{W}{L}} I_1} - V_{tp}}{R}\]$\mu_p$, $C_{ox}$, $V_{tp}$ will all vary from die to die, and wafer lot to wafer lot.
Solve that equation for $I_1$ and every process-dependent constant is inside it. Oxide grows a little thicker one lot, implant doses drift a little the next - the current changes even though every device on your die still matches its neighbor perfectly. That is the distinction to hold on to: process variation moves the whole die together; mismatch, later, moves neighbors apart.
Process corners
How do we simulate die-to-die movement? The foundry compresses it into corner models.
Common to use 5 corners, or Monte-Carlo process simulation
| Corner | NMOS | PMOS |
|---|---|---|
| Mtt | Typical | Typical |
| Mss | Slow | Slow |
| Mff | Fast | Fast |
| Msf | Slowish | Fastish |
| Mfs | Fastish | Slowish |
The foundry does not promise a particular die, it promises a box: every shipped wafer falls between slow-slow and fast-fast. Simulating the four corners plus typical asks “does the circuit still work at the walls of the box”. Monte Carlo instead samples the inside of the box, and is what you use when corners are too pessimistic or the failure is a yield number rather than a hard edge. Note that NMOS and PMOS need not move together - Msf and Mfs are exactly the corners that kill ratioed and skewed circuits.
Fix process variation
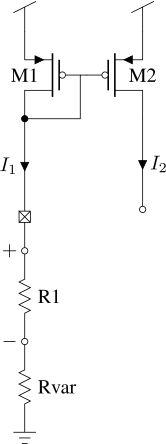
Process variation cannot be prevented, but it can be measured and corrected. Figure 43 shows the standard trick.
Use calibration: measure error, tune circuit to fix error
For every single chip, measure voltage across known resistor $R_1$ and tune $R_{var}$ such that we get $I_1 = 1 \mu A$
Be careful with multimeters, they have finite input resistance (typically 10 M$\Omega$)
Temperature variation
The mirror must also survive from -40 C to 125 C, and temperature pulls on the square law from two directions at once.
Mobility decreases with temperature
Threshold voltage decreases with temperature.
\[I_D = \frac{1}{2}\mu_n C_{ox} \frac{W}{L} (V_{GS} - V_{tn})^2\]More drain current charges the load capacitances faster, so high $I_D$ means fast digital circuits and low $I_D$ slow ones. So:
What is fast? High temperature or low temperature?
Two knobs fight each other. Mobility drops with temperature (more lattice scattering), which slows the transistor down. The threshold voltage also drops with temperature, which - at a fixed $V_{GS}$ - speeds it up. Which effect wins depends on how much $V_{eff}$ you have: at high $V_{DD}$ the mobility term dominates and hot means slow; near threshold the $V_{tn}$ term dominates and hot means fast. The crossover is called temperature inversion, and modern low-voltage processes sit close enough to it that you cannot guess - which is exactly why the slide below refuses to give a one-line answer.
It depends on $V_{DD}$
Fast corner
- Mff (high mobility, low threshold voltage)
- High $V_{DD}$
- High or low temperature
Slow corner
- Mss (low mobility, high threshold voltage)
- Low $V_{DD}$
- High or low temperature
How do we fix temperature variation?
For this resistor-plus-mirror bias the honest answer is short; the reference chapter builds the circuits that do better.
Accept it, or don’t use this circuit.
If you need stability over temperature, use 7.3.2 and 7.3.4 in CJM (SUN_BIAS_GF130N)
Random Variation
Even two transistors drawn identically, side by side, at the same temperature on the same die, are not identical. There are only a few thousand doping atoms under a small gate, and counting statistics does not care about your schematic: each device gets its own threshold voltage and its own $\ell$. Unlike everything above, this cannot be simulated away or laid out away - only averaged away with area.
\[\ell = \mu_p C_{ox} \frac{W}{L}\] \[I_D = \frac{1}{2} \ell (V_{GS} - V_{tp})^2\]Due to doping , length, width, $C_{ox}$, $V_{tp}$, … random variation
\[\ell_1 \ne \ell_2\] \[V_{tp1} \ne V_{tp2}\]As a result $I_1 \ne I_2$, but we can make them close.
Pelgrom’s law 2
Given a random gaussian process parameter $\Delta P$ with zero mean, the variance is given by
\[\sigma^2 (\Delta P) = \frac{A^2_P}{WL} + S_{P}^2 D^2\]where $A_P$ and $S_P$ are measured, and $D$ is the distance between devices
Assume closely spaced devices ($D \approx 0$) $\Rightarrow \sigma^2 (\Delta P) = \frac{A^2_P}{WL}$
Pelgrom’s law is bedrock: the variance of the difference between two matched devices scales as one over the gate area, because a bigger gate averages over more atomic-scale randomness. $A_P$ is a process constant you look up - for the threshold voltage it is a few mV per micrometer - and the $S_P D$ term says devices drift apart with distance, which is why matched pairs sit next to each other.
Pelgrom gives the spread of the raw parameters; what a designer needs is the spread of the current. Kinget’s expression 3 connects the two:
Transistors with same $V_{GS}$ 3
\[\frac{\sigma_{I_D}^2}{I_D^2} = \frac{1}{WL}\left[\left(\frac{gm}{I_D}\right)^2 \sigma_{vt}^2 + \frac{\sigma_{\ell}^2}{\ell^2}\right]\]Valid in weak, moderate and strong inversion
Kinget’s expression turns Pelgrom into design guidance: the relative current error has a threshold-voltage part, amplified by $(g_m/I_D)^2$, and a gain-factor part. Everything a designer chooses - region, area, current - is in there, and the two slides below read the two consequences straight out of it.
The $1/\sqrt{WL}$ scaling has a brutal price tag attached:
\(\frac{\sigma_{I_D}^2}{I_D^2} = \frac{1}{WL}\left[\left(\frac{gm}{I_D}\right)^2 \sigma_{vt}^2 + \frac{\sigma_{\ell}^2}{\ell^2}\right]\) \(\frac{\sigma_{I_D}}{I_D} \propto \frac{1}{\sqrt{WL}}\)
Assume $\frac{\sigma_{I_D}}{I_D} = 10\%$, We want $5\%$, how much do we need to change WL?
\[\frac{\frac{\sigma_{I_D}}{I_D}}{2} \propto \frac{1}{2\sqrt{WL}} = \frac{1}{\sqrt{4WL}}\]We must quadruple the area to half the standard deviation
\(1 \%\) would require 100 times the area
Area is not the only knob - the Kinget expression says the operating region matters too, and it cuts both ways:
What else can we do?
\[\frac{\sigma_{I_D}^2}{I_D^2} = \frac{1}{WL}\left[\left(\frac{gm}{I_D}\right)^2 \sigma_{vt}^2 + \frac{\sigma_{\ell}^2}{\ell^2}\right]\]Strong inversion $\Rightarrow \frac{gm}{I_D} = \frac{2}{V_{eff}} = low$
Weak inversion $\Rightarrow \frac{gm}{I_D} = \frac{q}{n k T} \approx 25$
Current mirrors achieve best matching in strong inversion
\[\frac{\sigma_{I_D}^2}{I_D^2} = \frac{1}{WL}\left[\left(\frac{gm}{I_D}\right)^2 \sigma_{vt}^2 + \frac{\sigma_{\ell}^2}{\ell^2}\right]\]For a differential pair the same mismatch is best expressed as a voltage: divide the current error by $g_m$ and it becomes the offset you would have to apply at the input to cancel it.
\[\sigma_{I_D}^2 = \frac{1}{WL}\left[gm^2 \sigma_{vt}^2 + I_D^2\frac{\sigma_{\ell}^2}{\ell^2}\right]\]Offset voltage for a differential pair
\[i_o = i_{o+} - i_{o-} = g_m v_i = g_m (v_{i+} - v_{i-})\] \[\sigma_{v_i}^2 = \frac{\sigma_{I_D}^2}{gm^2} = \frac{1}{WL}\left[\sigma_{vt}^2 + \frac{I_D^2}{gm^2}\frac{\sigma_{\ell}^2}{\ell^2}\right]\]High $\frac{gm}{I_D}$ is better (best in weak inversion)
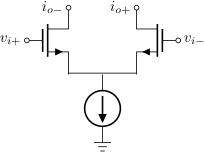
Figure 45: Differential pair
Threshold mismatch between the two input transistors appears directly as an input-referred offset voltage - the mismatch equation above divided by $g_m$.
Transistor Noise
Mismatch is randomness frozen in at manufacturing; noise is randomness that keeps happening while the circuit runs. Three flavors matter in a MOSFET, and they are connected: popcorn noise is one trap doing its thing, flicker noise is the chorus of many traps, and thermal noise is simply hot charge.
Thermal noise Random scattering of carriers in the channel \(PSD_{TH}(f) = \text{Constant}\)
Popcorn noise Carriers get “stuck” in oxide traps (dangling bonds) for a while. Can cause a short-lived (seconds to minutes) shift in threshold voltage \(PSD_{GR}(f) \propto \text{Lorentzian shape} \approx \frac{A}{1 + \left(\frac{f}{f_0}\right)^2}\)
Flicker noise Assume there are many sources of popcorn noise at different energy levels and time constants, then the sum of the spectral densities approaches flicker noise. \(PSD_{flicker}(f) \propto \frac{1}{f}\)
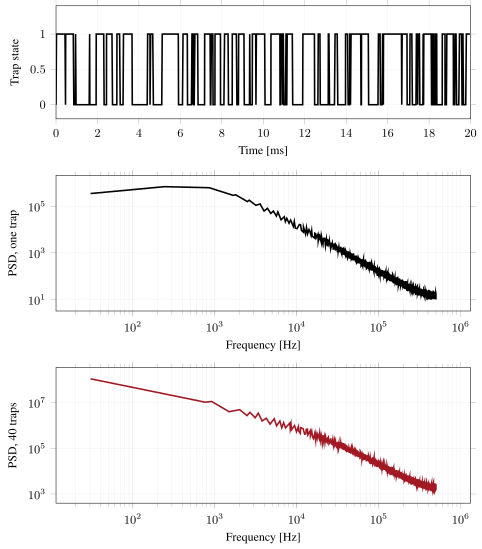
Figure 46: A single trap gives a two-level random telegraph signal (top) whose spectrum is a Lorentzian, flat then falling as $1/f^2$ (middle). Forty traps with time constants spread over three decades sum to a straight $1/f$, measured slope $-1.02$ between 100 Hz and 10 kHz (bottom)
The bottom panel is the argument of the last three paragraphs made visible, and it is worth noticing that nothing was fitted to make it come out: forty Lorentzians with corners spread evenly in log frequency were added up, and the sum is $1/f$ to within two percent over the band where those corners lie. Above the corner of the fastest trap the line steepens back towards $1/f^2$, because there are no faster traps left to hold the slope up. Real flicker noise ends the same way and for the same reason, which is why a measured $1/f$ corner is a statement about the traps in that process rather than a universal constant.
The drain current jumps between discrete levels as single carriers are trapped and released - visible directly in the time domain on small devices.
Noise equations
For hand calculation two spectral densities are enough. The channel is a piece of resistive silicon, so it makes thermal noise; the oxide interface has traps, so it makes flicker noise. Referred to the drain and the gate respectively:
Thermal noise current at the drain
\[\overline{i_{nd}^2} = 4 k T \gamma g_m \Delta f\] \[\gamma \approx 2/3 \text{ (long channel), } 1 \text{ to } 2 \text{ (short channel)}\]Flicker noise voltage at the gate
\[\overline{v_{ng}^2} = \frac{K_f}{W L C_{ox} f} \Delta f\]Noise corner, where the two are equal
\[f_c = \frac{K_f}{W L C_{ox}} \frac{g_m}{4 k T \gamma}\]Two design consequences fall straight out. Thermal noise, referred to the gate, is $4kT\gamma/g_m$ - spend current, get quiet. Flicker noise only cares about gate area. The corner $f_c$ where they cross can sit anywhere from kilohertz to beyond a hundred megahertz in nanoscale CMOS, so never assume flicker is a low frequency detail. If flicker hurts: more area, a PMOS input pair (holes run a little deeper, away from the interface traps), or the circuit tricks - chopping and autozeroing - from the noise chapter.
Summary
The one-page version of this chapter:
- The gate controls a barrier: weak inversion is exponential, strong inversion is quadratic
- Transconductance is two times current over overdrive, or current over nVT - whichever is smaller
- Intrinsic gain falls with overdrive and with shorter length
- Four capacitances set the speed: Cgs usually dominates the poles (it is the largest, think current mirrors), and Cgd gets multiplied by Miller
- Match with area (Pelgrom), buy speed with overdrive and short length, buy gain with long length
- Nothing is constant: supply, process, temperature, mismatch and noise all move - design for the box, not the point
Would you like to know more?
Pelgrom’s measurement of how mismatch scales with area, the paper the matching section rests on 2
Kinget’s translation of that into what mismatch costs a designer 3
Mark Lundstrom’s Essentials of MOSFETs, the most complete treatment of electrons in a MOSFET I know
-
L. L. Lewyn and T. Ytterdal and C. Wulff and K. Martin, Analog Circuit Design in Nanoscale CMOS Technologies 2009 https://doi.org/10.1109/JPROC.2009.2024663 ↩
-
M.J.M Pelgrom and A.C.J Duinmaijer and A.P.G Welbers, Matching properties of MOS transistors 1989 ↩ ↩2
-
Peter R. Kinget, Device mismatch and tradeoffs in the design of analog circuits 2005 ↩ ↩2 ↩3