sessions
Description
A session file captures the full viewer state — loaded files, plot tabs, waves, labels and annotations — so you can save a view and restore it later, or generate plots from the command line without opening the GUI.
Save via menu: File → Save Session (Ctrl+S)
Load from the command line:
cicwave --session mysession.cicwave.yaml
Export a session to PDF without opening the GUI:
cicwave --session mysession.cicwave.yaml --export plot.pdf
Combine session restore with export (useful for scripted plot generation):
cicwave --session mysession.cicwave.yaml --export plot.svg
Session file format
A session file is YAML with two top-level keys: files and plots.
File paths are relative to the session file location.
files:
  - path: ../data/tran.raw           # path to data file (required)
  - path: ../data/measurements.csv
    pivot: ../specs/pivot_spec.yaml   # optional pivot spec for this file
  - path: https://api.example.com/v1/measurements   # URL sources work too
    format: json                      # only needed for extension-less URLs
  - source: ../specs/measurements.yaml  # spec that fetches its own API data

plots:
  - name: "Transient"                # tab name
    title: "Amplifier Output"        # plot title (optional)
    xlabel: "Time"                    # custom x-axis label (optional)
    ylabel: "Voltage"                # custom y-axis label (optional)
    waves:
      - file: 0                      # index into the files list
        name: "v(out)"               # column / signal name
        style: Lines                  # Lines, Markers, Lines+Markers, Steps
      - file: 0
        name: "v(in)"
        style: Lines
      - file: 0
        name: "adc_code"
        twos_complement_bits: 12      # optional per-wave 2's complement decode
        digital: true                 # optional: show in the digital pane
        digital_format: hex           # hex (default) / dec / bin
    annotations:                      # optional list of text annotations
      - text: "settling"
        x: 1.5e-6
        y: 0.9
    xrange: [0, 2.0e-6]                # optional: saved zoom (x)
    yrange: [-0.5, 2.0]                # optional: saved zoom (y)
    cursor_a: 5.0e-7                   # optional: cursor A position (data coords)
    cursor_b: 1.5e-6                   # optional: cursor B position

  - name: "DC sweep"                 # second tab
    waves:
      - file: 1
        name: "Gain_T27"
        style: Lines
Session file reference
files — list of data files to load:
| Key | Required | Description |
|---|---|---|
path |
yes* | Path to the data file (relative to session file or absolute), or an http(s):// URL — see URL sources |
source |
yes* | Path to a pivot spec that fetches its own data from a REST API — see API sources. Replaces path (and pivot) for that entry |
pivot |
no | Path to a pivot spec YAML/JSON file to reshape this file before viewing |
format |
no | Forces the format for a URL path with no recognizable extension — same as CLI --format |
*Each entry has either a path or a source.
plots — list of plot tabs:
| Key | Required | Description |
|---|---|---|
name |
no | Tab name shown in the tab bar |
title |
no | Plot title displayed above the graph |
xlabel |
no | Custom x-axis label |
ylabel |
no | Custom y-axis label |
waves |
yes | List of waves to plot (see below) |
annotations |
no | List of text annotations (see below) |
xrange, yrange |
no | [min, max] zoom range to restore, in pyqtgraph’s own view coordinates (log10-space on the x-axis for a log-x plot) |
cursor_a, cursor_b |
no | Cursor A/B position, in real data coordinates (like annotations, not view coordinates) |
waves — list of signals to plot in a tab:
| Key | Required | Description |
|---|---|---|
file |
yes | Zero-based index into the files list |
name |
yes | Column name (signal name) in the data file |
style |
no | Plot style: Lines (default), Markers, Lines+Markers, or Steps |
twos_complement_bits |
no | Decode this wave as N-bit signed two’s complement (per-wave; independent of the global --twos-complement flag) |
digital |
no | true to show this wave in the digital pane instead of the analog axes |
digital_format |
no | Vector display format when digital: true: hex (default), dec, or bin |
group |
no | For a catalog spec: the group this wave came from, so restoring the session fetches that one group rather than the whole catalog |
annotations — list of text labels placed on the plot:
| Key | Required | Description |
|---|---|---|
text |
yes | Annotation text |
x |
yes | X position in data coordinates |
y |
yes | Y position in data coordinates |
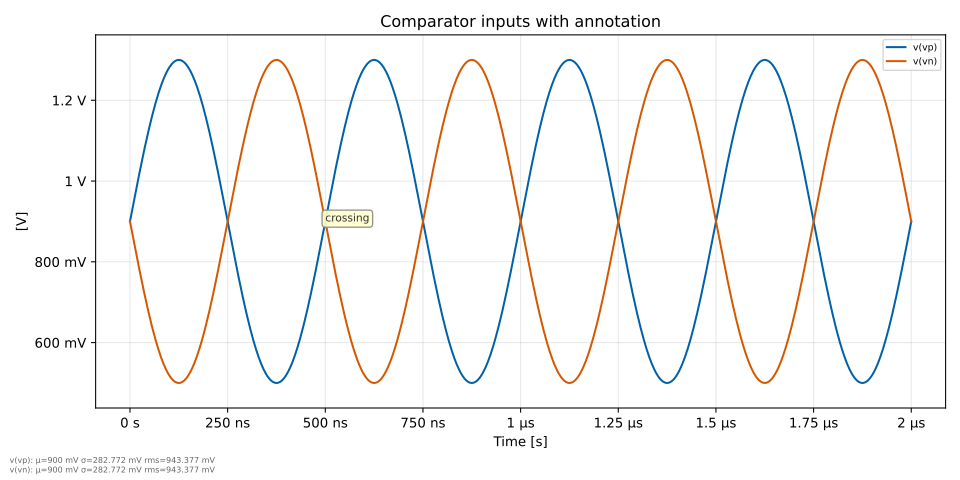
Example
A minimal session with two waves and one annotation:
(session_annotations.cicwave.yaml)
session_annotations.cicwave.yaml:
files:
  - path: test.csv
plots:
  - name: Annotated
    title: Comparator inputs with annotation
    waves:
      - file: 0
        name: "v(vp)"
        style: Lines
      - file: 0
        name: "v(vn)"
        style: Lines
    annotations:
      - text: "crossing"
        x: 5.0e-7
        y: 0.9
cicwave --session session_annotations.cicwave.yaml --export wave_annotations.svg