examples
- Description
- Single wave
- Multiple waves
- Dual Y-axes
- Pivoted data
- Real-world data from a URL
- Real-world data from a REST API
Description
The plots below are generated by the docs build itself (see make docs /
tests/docs/), by exporting real cicwave sessions against sample data —
some synthetic (tests/docs/gen_testdata.py), some a snapshot of a real
public dataset. They’re not hand-drawn screenshots — every push to
main regenerates them from a live run of cicwave --export, so they
never drift from what the tool actually renders.
There is example test data and session files in tests/docs. Navigate
to that directory to reproduce these locally.
Single wave
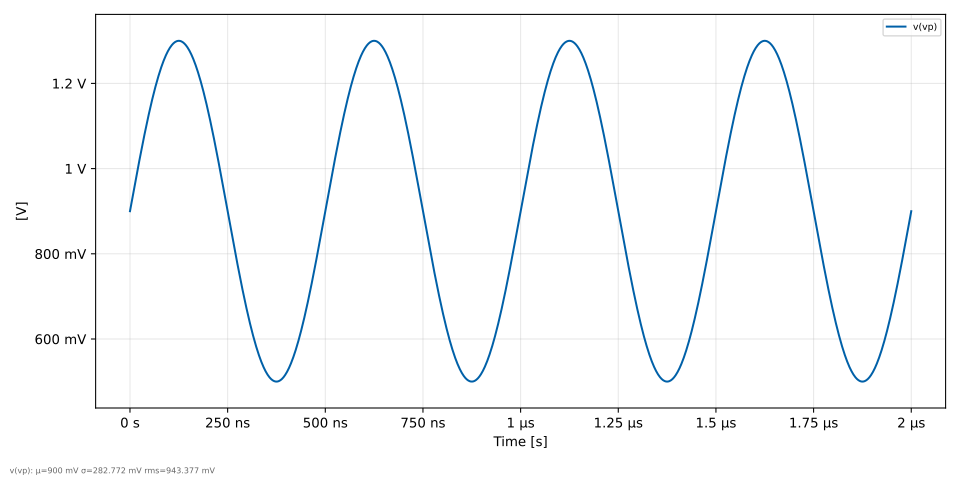
Plot a single voltage signal:
(session_single.cicwave.yaml)
cicwave --session session_single.cicwave.yaml --export wave_single.svg
Multiple waves
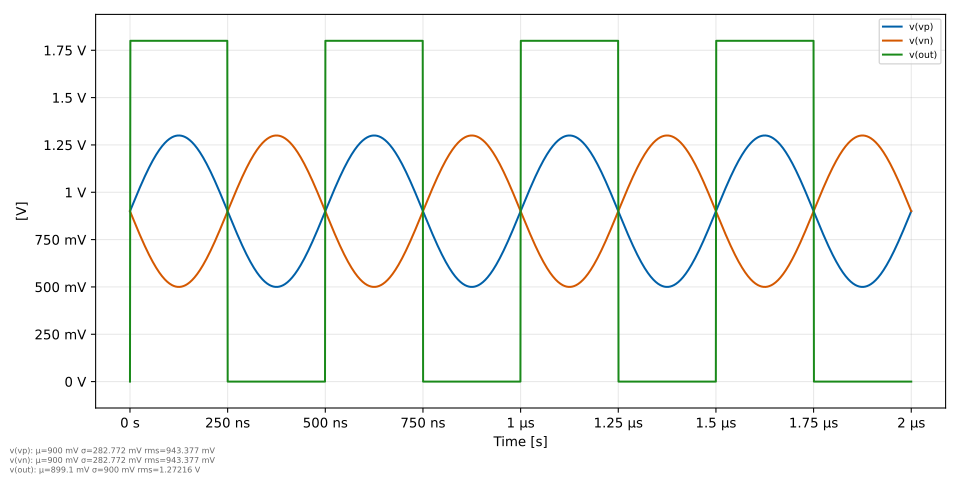
Plot multiple signals on the same axes:
(session_multi.cicwave.yaml)
cicwave --session session_multi.cicwave.yaml --export wave_multi.svg
Dual Y-axes
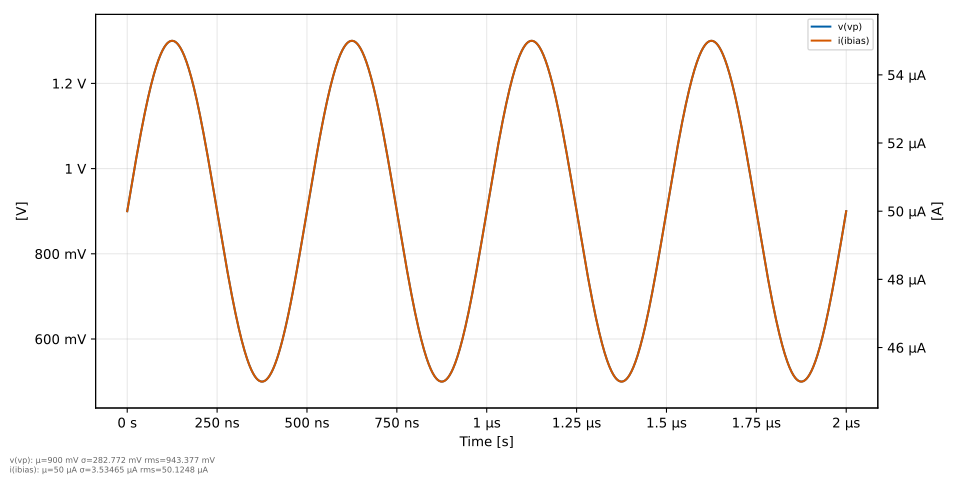
When voltage and current signals are plotted together, the pg backend
automatically assigns them to separate Y-axes based on their unit:
(session_dual.cicwave.yaml)
cicwave --session session_dual.cicwave.yaml --export wave_dual.svg
cat session_dual.cicwave.yaml
files:
  - path: test.csv
plots:
  - name: Dual Y-axes
    waves:
      - file: 0
        name: "v(vp)"
        style: Lines
      - file: 0
        name: "i(ibias)"
        style: Lines
Pivoted data
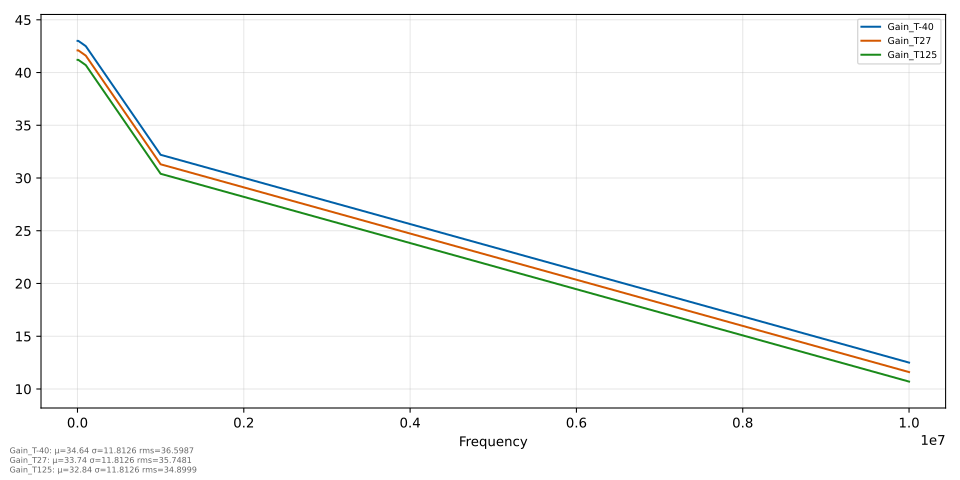
Reshaping a long-format sweep (Parameter, Frequency, Measurement,
Temp) into per-temperature gain waves with a pivot spec:
(session_pivot.cicwave.yaml,
pivot_spec.yaml)
cat pivot_spec.yaml
index: Parameter
columns: Frequency
values: Measurement
conditions:
  - Temp
cicwave --session session_pivot.cicwave.yaml --export wave_pivot.svg
Real-world data from a URL
cicwave can load data straight from an http(s) URL — a hosted CSV, a
REST API response, anything pandas can parse. See URL
sources for the full reference. The two examples
below use the pivot feature to reshape a long-format
public dataset (one row per country/year) into one wave per country, the
same way the synthetic pivot example above does.
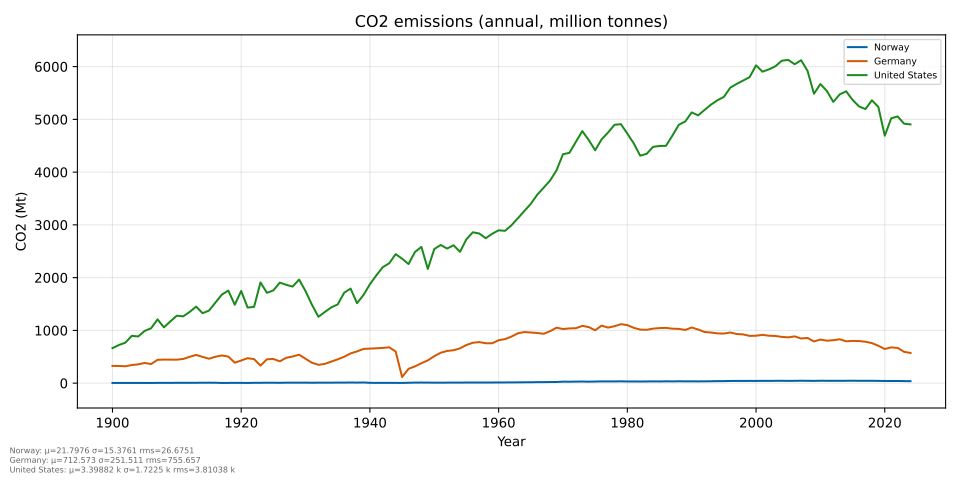
Climate: CO2 emissions per country
Data: Our World in Data CO2 & greenhouse gas emissions
dataset, loaded directly by URL.
(session_url_climate.cicwave.yaml,
pivot_spec_climate.yaml)
cicwave https://raw.githubusercontent.com/owid/co2-data/master/owid-co2-data.csv \
    --pivot pivot_spec_climate.yaml
cat pivot_spec_climate.yaml
pivot_spec_climate.yaml:
index: country
columns: year
values: co2
The plot below is generated from climate_url_snapshot.csv, a small
snapshot of that same dataset (see
fetch_url_snapshots.py) —
committed so the docs build stays deterministic and doesn’t depend on a
third-party endpoint being up at build time. The command above pulls
the live version.
cicwave --session session_url_climate.cicwave.yaml --export wave_url_climate.svg
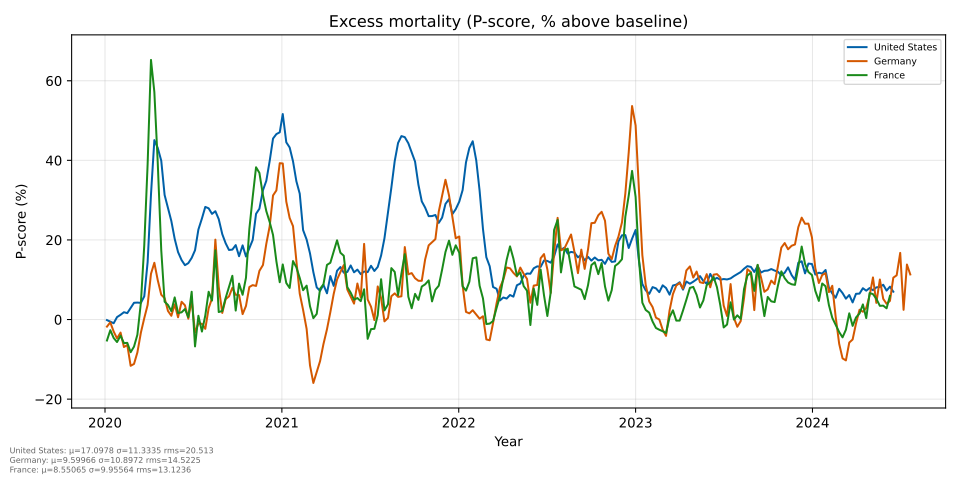
Health: excess mortality per country
Data: Our World in Data excess mortality
dataset
(P-score = % deaths above the pre-pandemic baseline).
(session_url_mortality.cicwave.yaml,
pivot_spec_mortality.yaml)
cicwave https://raw.githubusercontent.com/owid/covid-19-data/master/public/data/excess_mortality/excess_mortality.csv \
    --pivot pivot_spec_mortality.yaml
pivot_spec_mortality.yaml:
index: location
columns: year
values: p_scores_all_ages
Again, the plot below is generated from the committed
mortality_url_snapshot.csv snapshot for a reproducible build; the
command above fetches the live dataset.
cicwave --session session_url_mortality.cicwave.yaml --export wave_url_mortality.svg
Real-world data from a REST API
The examples above all start from a file. A pivot spec can instead carry
a source: block and fetch its own rows over
HTTP — no data file anywhere.
Where a repository’s pull requests landed
Data: the GitHub REST API, which
needs no token for a public repository. This is the shape a source:
block is for — the numbers are not in one response:
/repos/{owner}/{repo}/pullslists the pull requests, and/repos/{owner}/{repo}/pulls/{number}/fileshas to be called once per pull request to get what each one changed.
for_each issues that second request per row of the first, {number}
is filled in from the row, and merge carries the pull request number
onto every file it returns. The result is one table: file, pull
request, lines added.
(github_api_spec.yaml,
session_github_api.cicwave.yaml)
cicwave github_api_spec.yaml
github_api_spec.yaml:
#- Where the pull requests of this very repository touched its core
#- modules. Two endpoints: one lists the pull requests, and one has to
#- be called per pull request to get the files it changed -- the shape
#- a `source:` block exists for. Needs no token: these are public.
source:
  base_url: https://api.github.com
  requests:
    - name: pulls
      path: /repos/wulffern/cicwave/pulls
      params: {state: all, per_page: 20}
      keep: [number]

    - path: /repos/wulffern/cicwave/pulls/{number}/files
      for_each: pulls
      params: {per_page: 100}
      merge: [number]
      keep: [number, filename, additions]

  #- A pull request touches docs and tests too; the four modules the
  #- viewer is actually built from are enough to read at a glance.
  filter:
    filename:
      - src/cicwave/cli.py
      - src/cicwave/wave_pg.py
      - src/cicwave/wavefiles.py
      - src/cicwave/pivot.py

index: filename
columns: number
values: additions
unit: lines
The session that plots it names the spec under source: rather than
path:, since there is no data file to name:
session_github_api.cicwave.yaml:
files:
  #- No data file: the spec fetches its own rows from the GitHub API.
  - source: github_api_spec.yaml
plots:
  - name: Module churn
    title: Lines added per pull request, cicwave core modules
    xlabel: Pull request
    ylabel: Lines added
    waves:
      #- Markers as well as lines: a module touched by one pull request
      #- and not its neighbours is a single point, which a line cannot
      #- draw.
      - {file: 0, name: src/cicwave/cli.py, style: Lines+Markers}
      - {file: 0, name: src/cicwave/wave_pg.py, style: Lines+Markers}
      - {file: 0, name: src/cicwave/wavefiles.py, style: Lines+Markers}
      - {file: 0, name: src/cicwave/pivot.py, style: Lines+Markers}
Unlike the snapshots above, an API source only means anything if it
actually fetches — so for the build the service is swapped out rather
than the data:
render_github_api.py
replays a recorded copy of those seven GitHub responses
(github_api_snapshot.json) over localhost and points the committed
spec at it. Every request in the spec is really issued; only base_url
differs from the command above, which talks to GitHub.
python3 render_github_api.py wave_github_api.svg
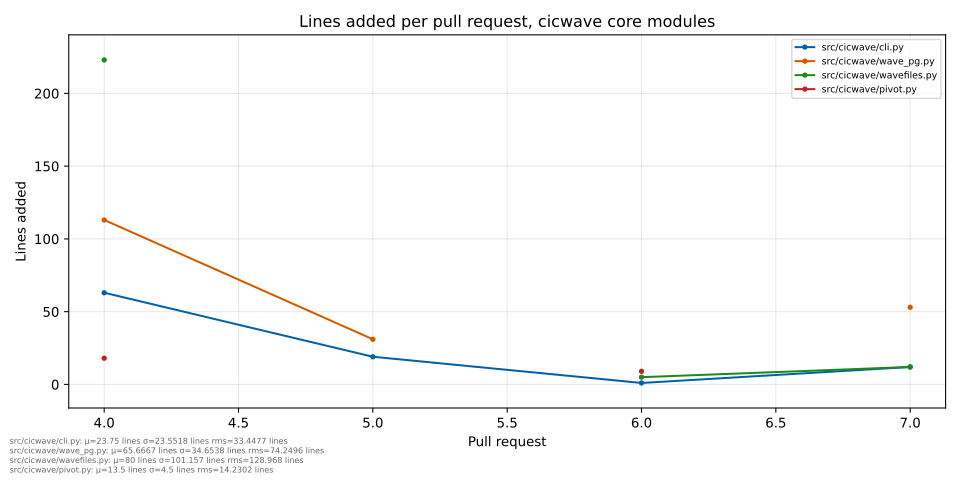 Each marker is one pull request touching one module. A module a pull
request did not touch has no point there, which is why some series are
dots rather than lines.
Each marker is one pull request touching one module. A module a pull
request did not touch has no point there, which is why some series are
dots rather than lines.